Heikin-Ashi chart looks like the candlestick chart but the method of calculation and plotting of the candles on the Heikin-Ashi chart is different from the candlestick chart. This is one of my favourite forex strategies out there.
In candlestick charts, each candlestick shows four different numbers: Open, Close, High and Low price. Heikin-Ashi candles are different and each candle is calculated and plotted using some information from the previous candle:
-
-
-
- Close price: Heikin-Ashi candle is the average of open, close, high and low price.
- Open price: Heikin-Ashi candle is the average of the open and close of the previous candle.
- High price: the high price in a Heikin-Ashi candle is chosen from one of the high, open and close price of which has the highest value.
- Low price: the high price in a Heikin-Ashi candle is chosen from one of the high, open and close price of which has the lowest valu Heikin-Ashi candles are related to each other because the close and open price of each candle should be calculated using the previous candle close and open price and also the high and low price of each candle is affected by the previous candle.
-
Heikin-Ashi chart is slower than a candlestick chart and its signals are delayed (like when we use moving averages on our chart and trade according to them).This could be an advantage in many cases of volatile price action.This forex day trading strategy is very popular among traders for that particular reason.It’s also very easy to recognise as trader needs to wait for the daily candle to close. Once new candle is populated, the previous one doesn’t re-paint.
You can access Heikin-Ashi indicator on every charting tool these days.
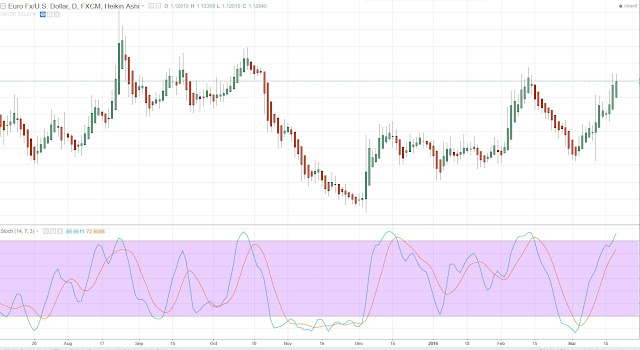
Lets see how a Heikin-Ashi chart looks -
-
How do I trade with it?On the chart above; bullish candles are marked in green and bearish candles are marked in red.The very simple strategy using Heikin-Ashi proven to be very powerful in back test and live trading.
The strategy combines Heikin-Ashi reversal pattern with one of the popular momentum indicators.My favourite would be a simple Stochastic Oscillator with settings (14,7,3). The reversal pattern is valid if two of the candles (bearish or bullish) are fully completed on daily charts as per GBPJPY screenshot below. -
SHORT SETUP
Once the price prints two red consecutive candles after a series of green candles, the uptrend is exhausted and the reversal is likely. SHORT positions should be considered.LONG SETUP
If the price prints two consecutive green candles, after a series of red candles, the downtrend is exhausted and the reversal is likely. LONG positions should be considered.FILTERS
The raw candle formation is not enough to make this day trading strategy valuable. Trader needs other filters to weed out false signals and improve the performance.MOMENTUM FILTER (Stochastic Oscillator 14,7,3)
We recommend to use a simple Stochastic Oscillator with settings 14,7,3 -

-
-

